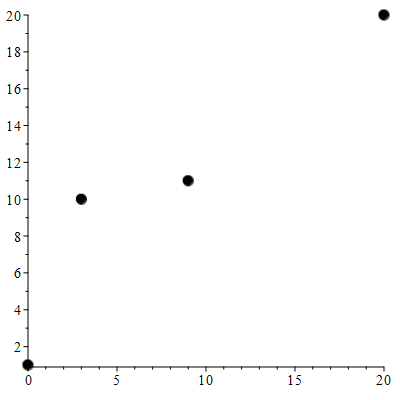
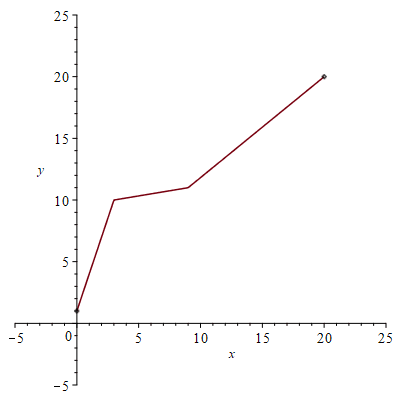
6. Recreate the image, with the points, in Maple.
>
>
(4.6.1)
>
>
>
>
>

![A := [0, 1]; 1; B := [3, 10]; 1; C := [9, 11]; 1; E := [20, 20]](images/Maple 19 SVDiff Calc Workbook Solutions_344.gif)
![Typesetting:-mprintslash([A := [0, 1]], [[0, 1]])](images/Maple 19 SVDiff Calc Workbook Solutions_345.gif)
![Typesetting:-mprintslash([B := [3, 10]], [[3, 10]])](images/Maple 19 SVDiff Calc Workbook Solutions_346.gif)
![Typesetting:-mprintslash([C := [9, 11]], [[9, 11]])](images/Maple 19 SVDiff Calc Workbook Solutions_347.gif)
![Typesetting:-mprintslash([E := [20, 20]], [[20, 20]])](images/Maple 19 SVDiff Calc Workbook Solutions_348.gif)

![Pts := pointplot([A, B, C, E], symbolsize = 20, symbol = solidcircle);](images/Maple 19 SVDiff Calc Workbook Solutions_350.gif)